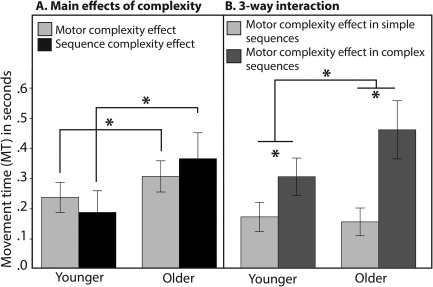
Figure 2.

Behavioral results. The line charts present the results for the analysis of MT. In (A), the Complexity effects [Duration complex – Duration simple] are shown separately for each group (young, older) and each manipulation (syllable complexity, sequence complexity). In (B), the 3‐way (Group × Sequence complexity by Syllable Complexity) interaction is decomposed. The Syllable complexity effect (Duration complex syllable – Duration simple syllable) is shown separately for the simple and complex sequences, for the young and older adults. For both charts, error bars represent the standard error of the mean (SE). Asterisks indicate significance at P ≤ 0.05.
