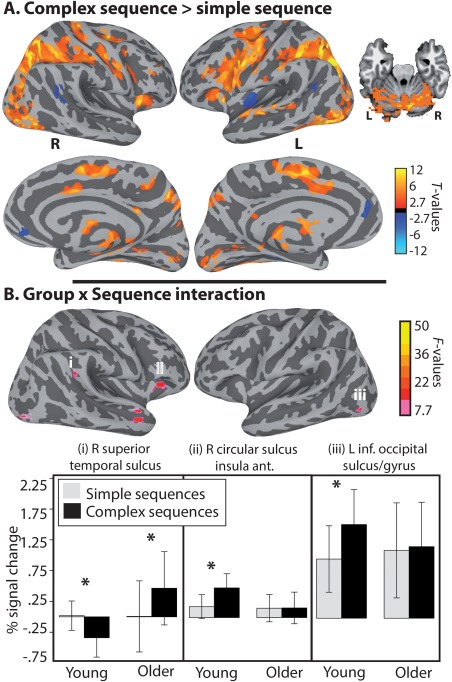
Figure 5.

Sequence complexity effects. (A) Group‐level FWE‐corrected contrast of complex and simple sequences. (B) Group‐level FWE‐corrected 2‐way interaction between Group and Sequence complexity. The bar graphs illustrate the interaction in three regions, the right superior temporal sulcus, the right circular sulcus of the anterior insula and the left inferior occipital sulcus/gyrus, separately for the young (light gray bar) and older adults (black bar). The x‐axis represents the Sequence complexity effect (complex – simple sequence). The error bars represent the standard error of the mean (SE). Asterisks indicate significance at P ≤ 0.05. Cortical activation is shown on the group average smoothed white matter folded surfaces. Cerebellar activation is shown on an axial slice of an MNI template (TT_N27). L = left hemisphere; R = right hemisphere. [Color figure can be viewed at http://wileyonlinelibrary.com]
