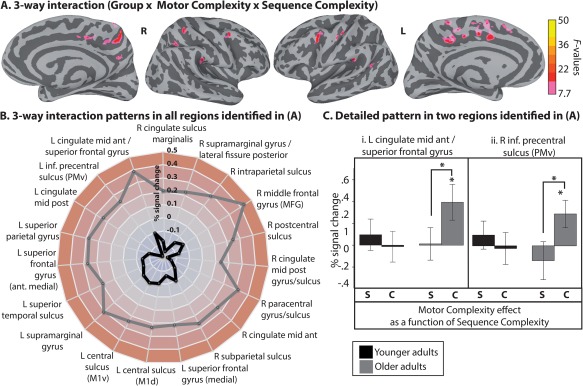
Figure 6.

Three‐Way interactions. (A) Group‐level FWE‐corrected interaction between Group, Motor complexity and Sequence complexity. Activation is shown on the group average smoothed white matter folded surfaces. (B) A radar chart summarizes the response patterns that were found in regions identified in the group analysis illustrated in A. Each dimension (radii) in the radar chart corresponds to a region. The longer the radii, the stronger the difference score (in percentage of BOLD signal change), which represents the difference in Motor complexity effect across Sequence complexity levels [Complex sequence [complex– simple syllable] – Simple sequences [Complex– simple syllable]] separately for the young (black line) and older adults (gray line). As shown in the chart, the interaction was stronger for the older adults in all regions. (C) The detail of this response pattern is provided for two regions as examples. The x‐axis represents the Motor complexity effect (complex – simple syllable) in the simple sequence condition (S) and complex sequence (C), separately for the younger (black bars) and older adults (gray bars). The error bars represent the standard error of the mean (SE). Asterisks indicate significance at P ≤ 0.05. L = left hemisphere; R = right hemisphere. [Color figure can be viewed at http://wileyonlinelibrary.com]
