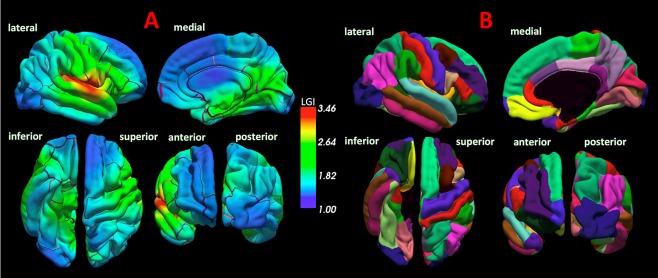
Figure 1.

The local gyrification index (LGI) map and the automated cortical parcellation. The panel A represents the LGI maps of all subjects which were separately created in the analysis, and the color bar represents LGI scale. The panel B represents the cortical parcellation criteria of the Desikan–Killiany atlas. [Color figure can be viewed at http://wileyonlinelibrary.com]
