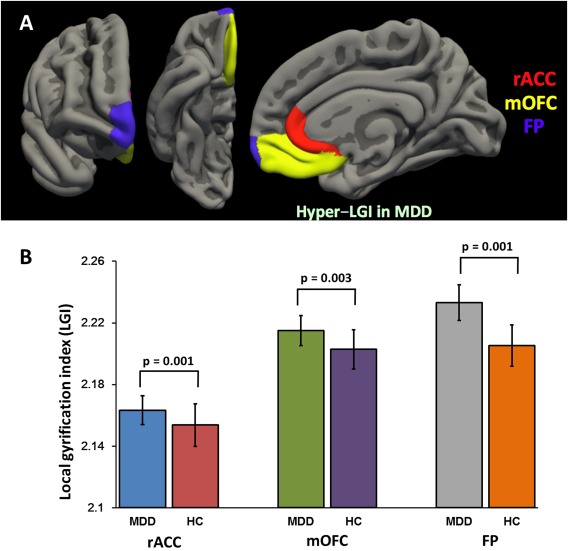
Figure 2.

Significant difference of the mean local gyrification index (LGI) values between the patients with major depressive disorder (MDD) and healthy controls (HCs). The panel A represents the statistical comparison map of LGI values between the MDD and HC group, and the panel B shows significant difference of LGI values between the groups. Hypergyria in the right rostral anterior cingulate cortex (rACC, P = 0.001), medial orbitofrontal cortex (mOFC, P = 0.003), and frontal pole (FP, P = 0.001) was observed in the patients with MDD compared with HCs. [Color figure can be viewed at http://wileyonlinelibrary.com]
