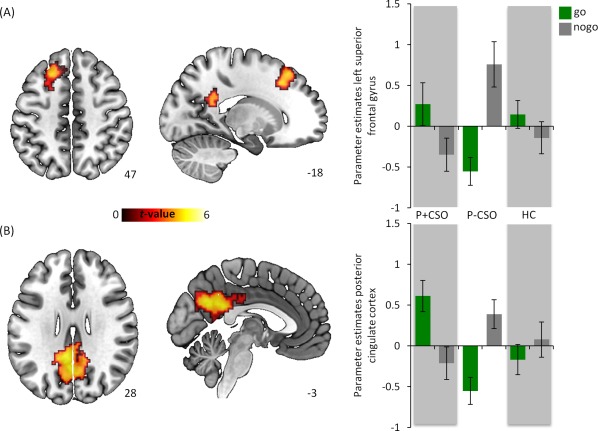
Figure 3.

Between group fMRI analysis. Post‐hoc examination of the nogo > go contrast revealed a significantly increased activation in the (A) PCC (MNI x = −2, y = −59, z = 31) and (B) left superior frontal gyrus (MNI x = −20, y = 24, z = 43) in the P‐CSO group as compared to the P + CSO group. Parameter estimates and standard errors derived from 3mm spheres around the according peak voxels. The statistical threshold map was set to P < 0.001 uncorrected (height threshold) and P < 0.05 FWE corrected (extent threshold) for illustrative purposes. [Color figure can be viewed at http://wileyonlinelibrary.com]
