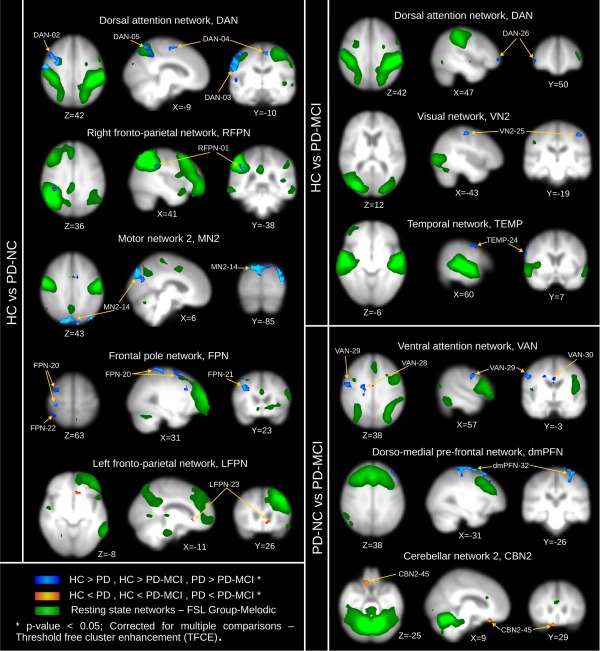
Figure 2.

Dual‐regression results for between group comparisons: HC vs. PD‐NC, HC vs. PD‐MCI, and PD‐NC vs. PD‐MCI. Regions and MNI coordinates are described in Table 2. HC, healthy controls; PD‐NC, PD with normal cognition; PD‐MCI, PD with mild cognitive impairment; DAN, dorsal attention network; RFPN, right fronto‐parietal network; MN2, motor network 2; FPN, fronto‐polar network; LFPN, left fronto‐parietal network; VN2, visual network 2; TEMP, temporal network; dmPFN, dorso‐medial prefrontal network; CBN2, cerebellar network 2. Brain maps are presented in radiological convention, that is, right is left hemisphere. [Color figure can be viewed at http://wileyonlinelibrary.com]
