
Figure 2.
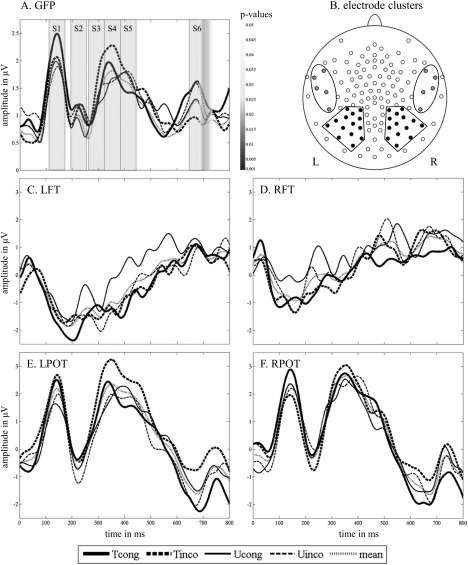
EEG data. A. GFP of the four audiovisual conditions and mean GFP curve. Grey bars indicate the analyzed time segments (S1: 110‐170 ms, S2: 192‐252 ms, S3: 260‐320 ms, S4: 321‐381 ms, S5: 382‐442 ms, and S6: 644‐704 ms). Greyscale bar shows the significant time window of the TANOVA on the congruency effect difference between trained and untrained grapheme‐phoneme pairs. B. 128‐channel map. The illustrated frontotemporal (FT) and parietooccipitotemporal (POT) electrode clusters, marked in grey and black respectively, were used in the ERP analyses. C. ERP curves of the four audiovisual conditions and their mean over the left frontotemporal electrode cluster (LFT). D. ERP curves of the four audiovisual conditions and their mean over the right frontotemporal electrode cluster (RFT). E. ERP curves of the four audiovisual conditions and their mean over the left parietooccipitotemporal electrode cluster (LPOT). F. ERP curves of the four audiovisual conditions and their mean over the right parietooccipitotemporal electrode cluster (RPOT).