
Figure 6.
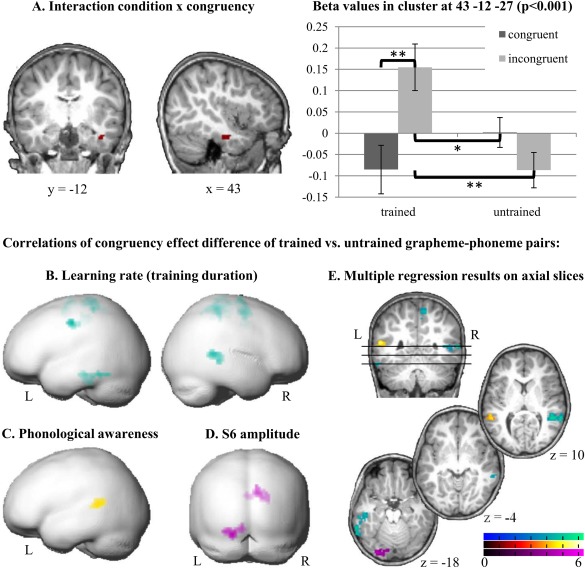
fMRI results. A. Interaction of congruency and condition in the right ITG. Activation in this region was significantly stronger for Tinco compared to Tcong, Ucong, and Uinco (P < 0.001 uncorrected). Error bars illustrate standard error of the mean. B–D. Individual BOLD contrast differences (congruency effect of trained vs. untrained grapheme‐phoneme pairs) correlated negatively with training duration (learning rate defined as faster learning) in the left ITG extending to the fusiform gyrus and the right STG/MTG (B), positively with phonological awareness in the left STG (C), and positively with the mean amplitude value of the incongruency effect over the left parietotemporal cluster of the late negativity (S6) ERP component (D). Multiple regressions are illustrated on the rendered surface of a pediatric brain template (Wilke and Holland, 2003; P < 0.001 uncorrected; cluster level FWE corrected P < 0.05). E. Brain regions showing a significant multiple regression with learning rate (cyan), phonological awareness (yellow), and S6 ERP amplitude (purple) are projected onto a pediatric structural T1 image normalized to MNI space (P < 0.001 uncorrected; cluster level FWE corrected P < 0.05).