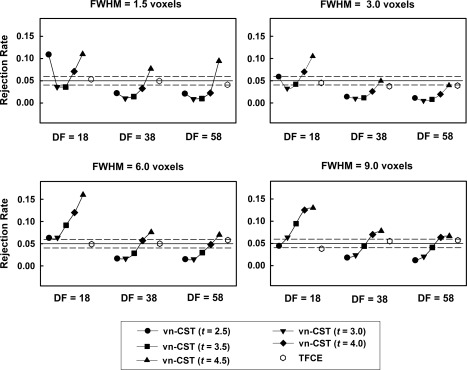
Figure 1.

Results for the simulated stationary null fMRI data. Both methods were compared for three sample sizes (df = 18, 38 and 58) and three smoothness levels (FWHM =1.5, 3, 6 and 9 voxels). For vn‐CST, the applied CDT were 2.5 to 4.5. The desired FWE‐corrected P‐value of the test was 0.05.
