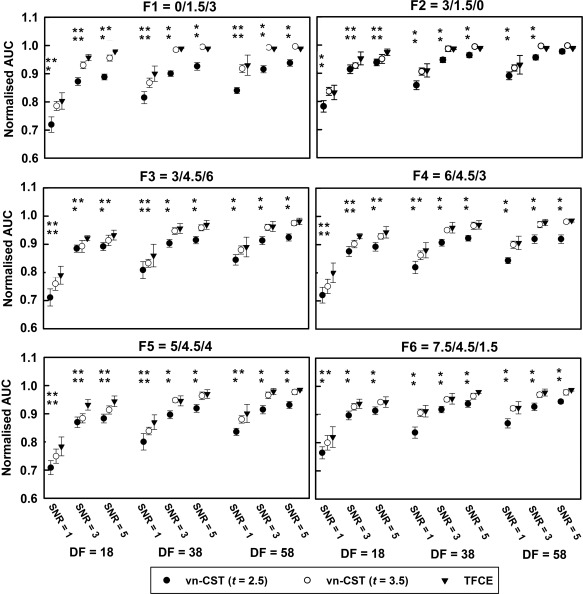
Figure 4.

AUC results for the simulated non‐stationary task fMRI data. Six different non‐stationarity settings were used. All methods were compared for different sample sizes (df = 18, 38 and 58) and SNRs (SNR = 1, 3 and 5). For vn‐CST, the results for CDTs of 2.5 and 3.5 are shown. The FWE‐corrected P‐value of the test was 0.05. All vn‐CST significance levels are compared with those using TFCE (*: P < 0.05, **: P < 0.001).
