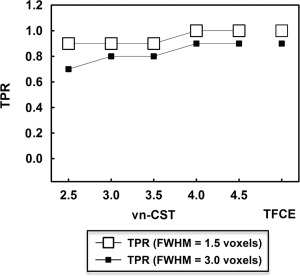
Figure 5.

TPR for the group‐level rfMRI data analysis. The significance level was set to FWE‐corrected P = 0.05 and CDTs = 2.5, 3.0, 3.5, 4.0 and 4.5 are shown for vn‐CST. FWHMs of the applied Gaussian filters were 1.5 and 3 voxels. No false positive clusters were detected by vn‐CST or TFCE at either smoothness level.
