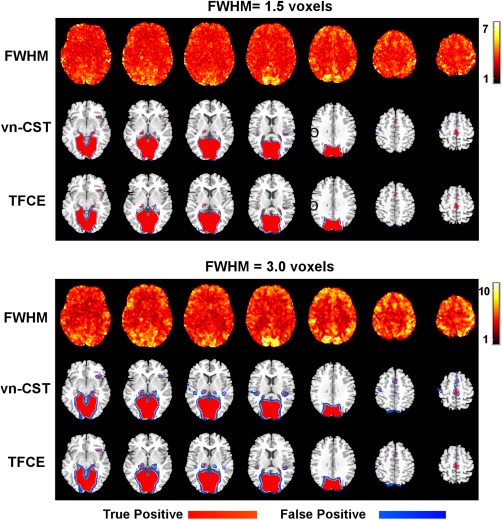
Figure 6.

The detected activation map for the group‐level rfMRI analysis at the significance level of 0.05. For vn‐CST, the CDT was 3.0. FWHMs of the applied Gaussian filters were 1.5 voxels (top four rows) and 3 voxels (bottom four rows). Rows 1 and 4 show the variation in image smoothness using the voxelation‐corrected local smoothness based on Eq. (1) (obtained as RPVic^(1/3)). A region that was significant with TFCE but not vn‐CST was shown in black circles. [Color figure can be viewed at http://wileyonlinelibrary.com]
