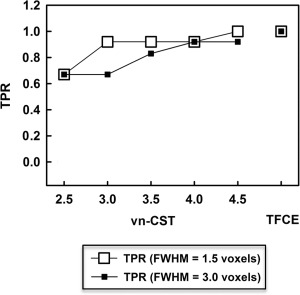
Figure 7.

TPR for the simulated inter‐group differences VBM analysis using vn‐CST and TFCE methods at the significance level of 0.05. For vn‐CST, results are shown with CDTs = 2.5, 3.0, 3.5, 4.0 and 4.5. FWHMs of the applied Gaussian filters were 1.5 and 3 voxels. There were no detected false‐positives for either TFCE or vn‐CST.
