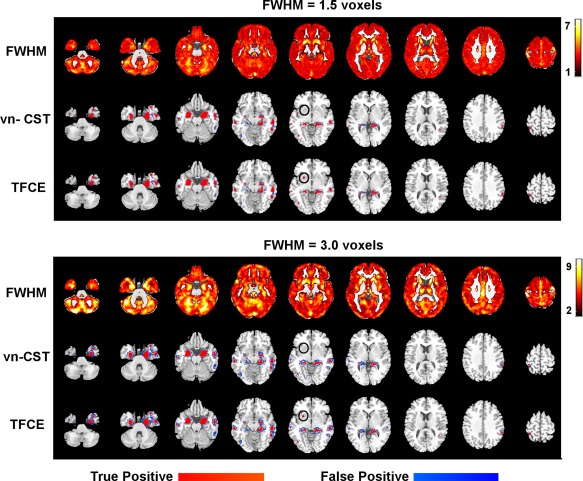
Figure 8.

VBM results for the analysis with simulated inter‐group differences using vn‐CST and TFCE methods. FWE‐corrected P‐value was set to 0.05. For vn‐CST, the CDT = 3.0. FWHMs of the applied Gaussian filters were 1.5 voxels (top three rows) and 3 voxels (bottom three rows). Rows 1 and 4 show the variation in image smoothness using the voxelation‐corrected local smoothness based on Eq. (1) (obtained as RPVic^(1/3)). A region that was significant with TFCE but not vn‐CST was shown in black circles. [Color figure can be viewed at http://wileyonlinelibrary.com]
