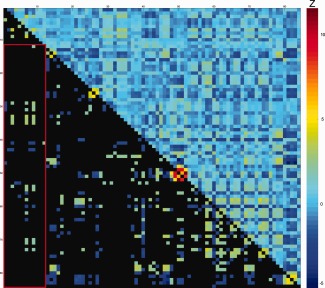
Figure 2.

Difference scores of partial correlations between intra‐individual variability and white matter microstructure for ASD and controls. Values represent ΔZ‐scores, controlled for TMI. Upper diagonal: all ΔZ‐scores between ASD and CTRL for DTI parameters and Flanker measures. Lower diagonal: significant ΔZ‐scores ΔZ > |1.96|); non‐significant values in black. Warm colors indicate more positive partial‐correlation in ASD than in controls (e.g. rho‐ASD= −0.15 and rho‐CTRL = −0.44; or rho‐ASD = 0.44 and rho‐CTRL = 0.15; both result in positive ΔZ‐scores). Cool colors indicate more positive partial‐correlation in controls than in ASD (e.g. rho‐ASD = −0.44 and rho‐CTRL = −0.15; or rho‐ASD = 0.15 and rho‐CTRL = 0.44; both result in negative ΔZ‐scores). See Table 3 for exact values, also in‐text explanation and original partial‐correlations in Supporting Information Fig. 4. For denotation of rows/columns see Supporting Information Table VI. [Color figure can be viewed at http://wileyonlinelibrary.com.]
