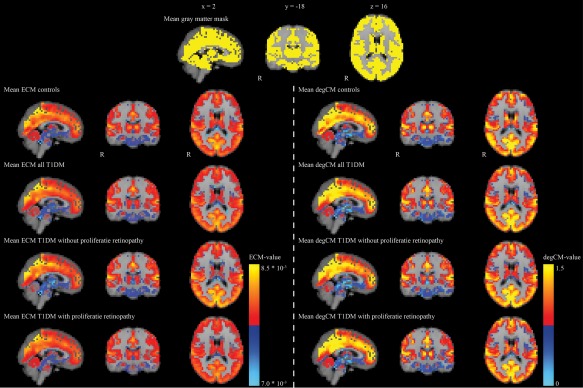
Figure 1.

The common gray matter mask is shown in the top panel in yellow. Mean eigenvector centrality and degree centrality maps of all controls and patients, and separately the patients without and with proliferative retinopathy are given. Red and yellow colors indicate high centrality values, whereas blue colors indicate low centrality values. DegCM = degree centrality. ECM = eigenvector centrality mapping. T1DM = type 1 diabetes. Images are presented in radiological orientation. [Color figure can be viewed at http://wileyonlinelibrary.com]
