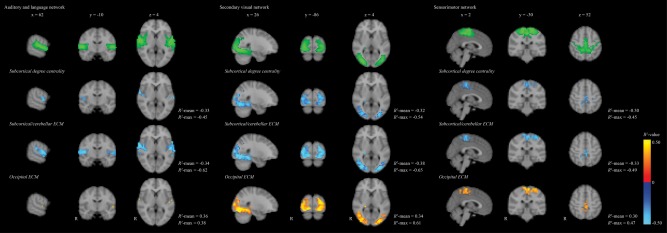
Figure 3.

Schematic representation of the correlation between lower subcortical/cerebellar and higher occipital eigenvector centrality and lower subcortical degree centrality with functional connectivity in the auditory and language, secondary visual and sensorimotor RSNs in all T1DM patients. The top shows in green the RSN networks thresholded at z < 3.9, overlaid on a 4 mm standard brain. The voxels showing statistically significant correlations between centrality and functional connectivity were thresholded at P FWE < 0.05. The correlation coefficient was calculated as the R 2 for the model of centrality, corrected for age, sex, systolic blood pressure, and depressive symptoms. Lighter blue colors indicate higher negative R 2‐values, whereas more yellow colors indicate higher positive R 2‐values. ECM = eigenvector centrality mapping, T1DM = type 1 diabetes. [Color figure can be viewed at http://wileyonlinelibrary.com]
