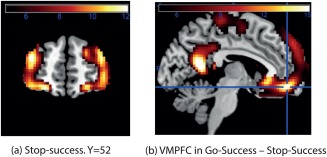
Figure 3.

Further neuroimaging results. (a) The activation for SS thresholded at P < 1e‐8, corresponding to t = 5.75, to show the regions of the lateral OFC and DLPFC that were activated. (b). Contrast of Go trials ‐ stop trials. The whole of the ventromedial prefrontal cortex (VMPFC) was more strongly activated than the lateral OFC areas. [Color figure can be viewed at http://wileyonlinelibrary.com]
