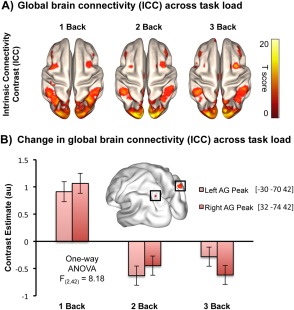
Figure 1.

Global brain connectivity across increasing n‐back working memory load. (A) Group t‐tests for each memory load produced intrinsic connectivity contrast (ICC) maps illustrating the global brain connectivity profiles across three levels of working memory loads (1, 2, 3‐Back). The highly connected areas overlap with established LSNs from published literature. (B) The subsequent repeated measures ANOVA F‐contrast showed that the angular gyri (AG) were the brain areas with the greatest ICC change across the three experimental loads. All reported clusters are FWE corrected at the 0.05 level of significance (voxel 0.001 uncorrected) and are displayed on a smooth MNI152 brain. [Color figure can be viewed at http://wileyonlinelibrary.com.]
