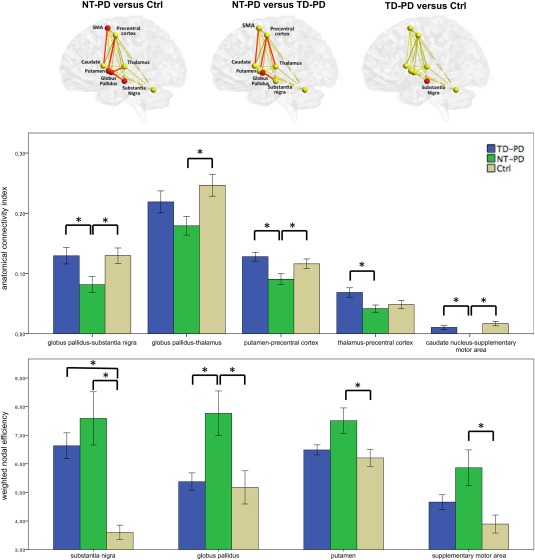
Figure 2.

Group differences in MRI network metrics (i.e., connectivity index and weighted nodal efficiency). Spheres and lines represent brain nodes and edges, with red spheres and red lines indicating respectively the nodes and the edges showing significance between groups (top). Anatomical connectivity index and weighted nodal efficiency mean values for each brain edges and nodes, respectively (bottom). Regarding the MRI network metrics in the figure, we considered the more affected side for patients with Parkinson's disease, and the average of right and left side for control subjects. NT‐PD, patients with nontremor Parkinson's disease; TD‐PD, patients with tremor‐dominant Parkinson's disease; *P value <0.05 after false discovery rate correction. [Color figure can be viewed at http://wileyonlinelibrary.com]
