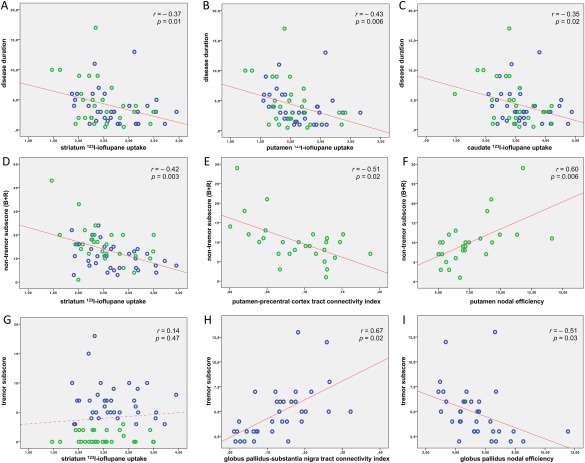
Figure 3.

Correlation analysis. Correlation scatterplots of the clinical variables [disease duration (A–C), nontremor subscore (D–F), and tremor subscore (G–I)] with the functional and structural neuroimaging metrics of more affeceted side, in all PD patients (A–C, D, G), in NT‐PD patients (E, F), and in TD‐PD patients (H, I). UPDRS‐ME subscores in PD subgroups (panels E, F and panels H, I) are, respectively, the nontremor and tremor subscores of more severely affected limbs. 123I‐ioflupane uptake ratios and MRI network metrics (i.e., anatomical connectivity indices and weighted nodal efficiency values) are reported on the x axis; clinical data are reported on the y axis; blue = patients with TD‐PD; green = patients with NT‐PD; r = Spearman's correlation coefficient; P = P value corrected according to false discovery rate. [Color figure can be viewed at http://wileyonlinelibrary.com]
