
Figure 5.
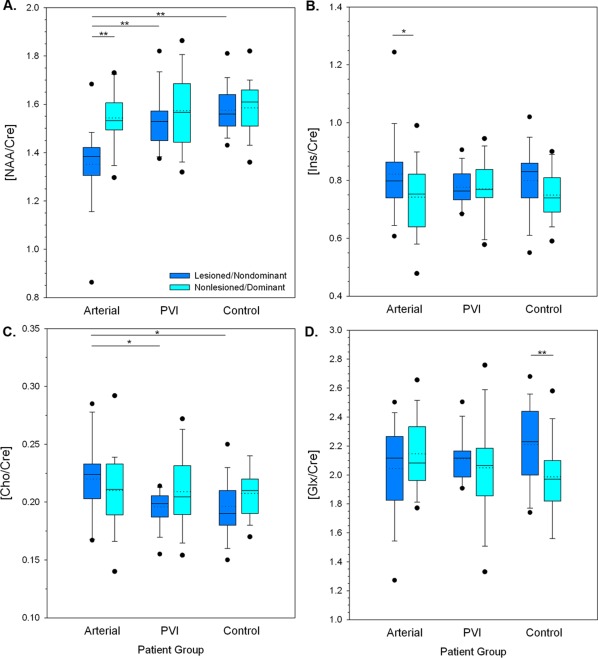
A–D. Boxplots illustrating metabolite concentrations (using creatine concentration ratios) by patient group and hemisphere. A. N‐acetyl‐aspartate (NAA/Cre), B. myo‐Inositol (Ins/Cre) C. Choline compounds (Cho/Cre), D. Glutamate + glutamine (Glx/Cre). Median (solid line) and mean (dotted line) concentrations as well as quartile ranges and outliers (filled circles) are displayed. ** P < 0.01, * P < 0.05. [Color figure can be viewed at http://wileyonlinelibrary.com]