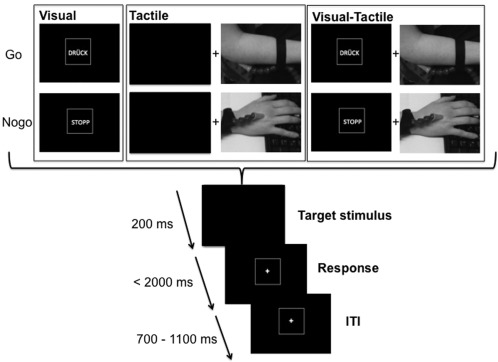
Figure 1.

Schematic illustration of the Go/Nogo paradigm. The Figure shows the visual condition (left), the tactile condition (middle) and the visual‐tactile condition (right). In the visual‐tactile condition, the visual and tactile stimulus in Go and Nogo conditions was presented simultaneously. At the bottom of the figure, the timing of the stimuli, response deadlines and ITI is shown.
