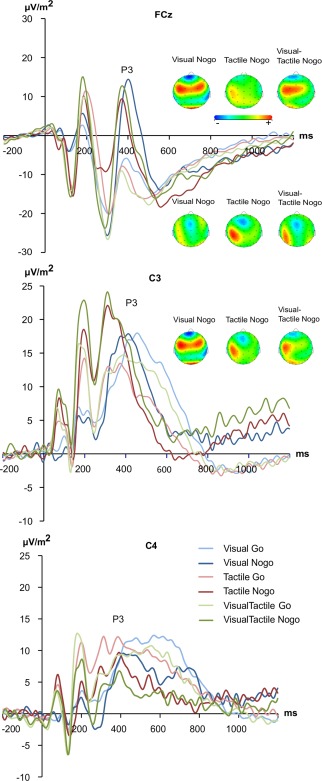
Figure 3.

The N2 and P3 event related‐potentials shown at electrode FCz, C3, and C4. The y‐axis denotes μV/m2 and the x‐axis denotes time in ms. Time point zero denotes the time point of delivering Go or Nogo stimuli. Blue lines denote the ERPs in the visual, red in the tactile and green in the visual‐tactile condition; darker and brighter shading of these colours denote Nogo or Go trials, respectively. The scalp topography plots for Go and Nogo conditions are shown for each experimental condition. Warm colors indicate positive and cold colors denote negative amplitudes. [Color figure can be viewed at http://wileyonlinelibrary.com]
