
Figure 4.
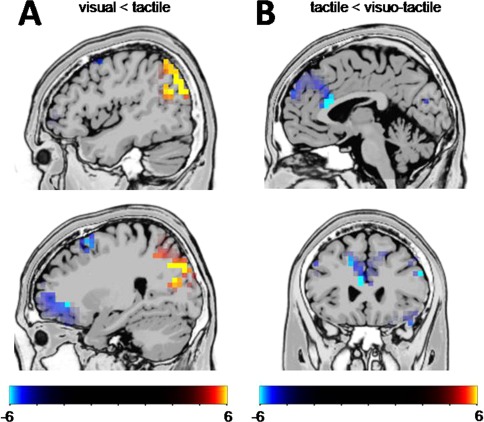
(A) Results from the sLORETA analysis contrasting the Nogo visual against the Nogo tactile condition for the time point of the Nogo‐N2 peaks. The differences in activations are located in the right hemisphere. (B) Results from the sLORETA analysis contrasting the Nogo tactile against the Nogo visuotactile condition. The images show critical t‐values. [Color figure can be viewed at http://wileyonlinelibrary.com]