
Figure 2.
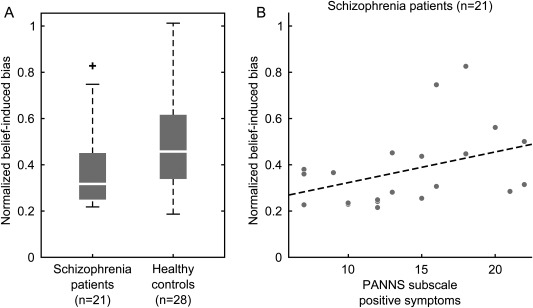
Behavioural belief‐induced bias in schizophrenia. (A) Schizophrenia patients showed a significantly lower belief‐induced bias than healthy controls (P = 0.03, two‐sided Wilcoxon signed rank test). The belief‐induced bias was calculated as the ratio of belief‐congruent and belief‐incongruent mean phase durations normalized with respect to the learning phase. Higher values indicate a stronger belief‐induced bias. Whiskers of the boxplots represent 1.5 interquartile distances. (B) In schizophrenia patients, the belief was correlated with the severity of positive symptoms (r = 0.51, P = 0.02, two‐sided Spearman's rank correlation). The severity of positive symptoms was quantified by the PANNS score on the positive symptoms scale. Each dot represents one individual, the dotted line is the least squares regression line.