
Figure 1.
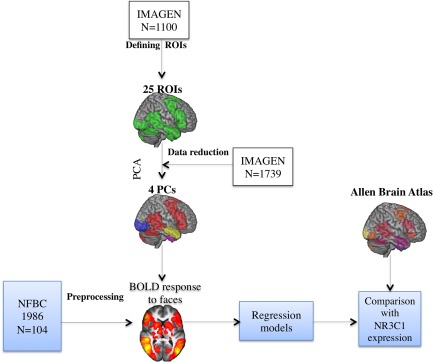
Flowchart depicting the analyses of our study. Abbreviations: ROI, region of interest; PCA, principle component analysis; BOLD, blood‐oxygen‐level dependent. [Color figure can be viewed at http://wileyonlinelibrary.com]
Official websites use .gov
A
.gov website belongs to an official
government organization in the United States.
Secure .gov websites use HTTPS
A lock (
) or https:// means you've safely
connected to the .gov website. Share sensitive
information only on official, secure websites.
Flowchart depicting the analyses of our study. Abbreviations: ROI, region of interest; PCA, principle component analysis; BOLD, blood‐oxygen‐level dependent. [Color figure can be viewed at http://wileyonlinelibrary.com]