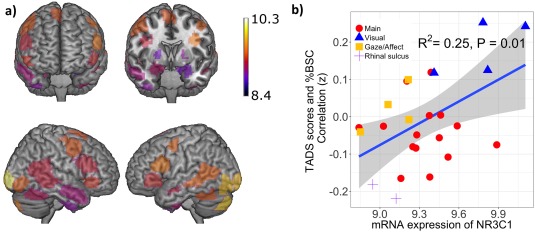
Figure 4.

(a) Spatial representation of the mRNA expression of NR3C1 across the 25 ROIs. (b) Correlation of the NR3C1 mRNA expression—across the 25 ROIs—with the magnitude of associations between adversity and brain response to fearful faces. Regression line is plotted with shaded 95% CI. [Color figure can be viewed at http://wileyonlinelibrary.com]
