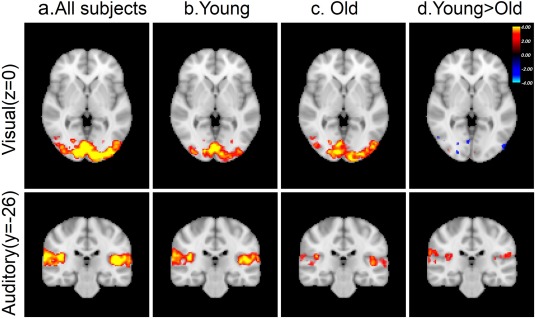
Figure 1.

Brain activation induced by visual (top row) and auditory (bottom row) stimuli illustrated by color‐coded z‐statistics overlaid on the MNI template for (a) all subject combined, (b) only young subjects, (c) only old subjects, and (d) the contrast between young and old subjects. [Color figure can be viewed at http://wileyonlinelibrary.com]
