
Figure 2.
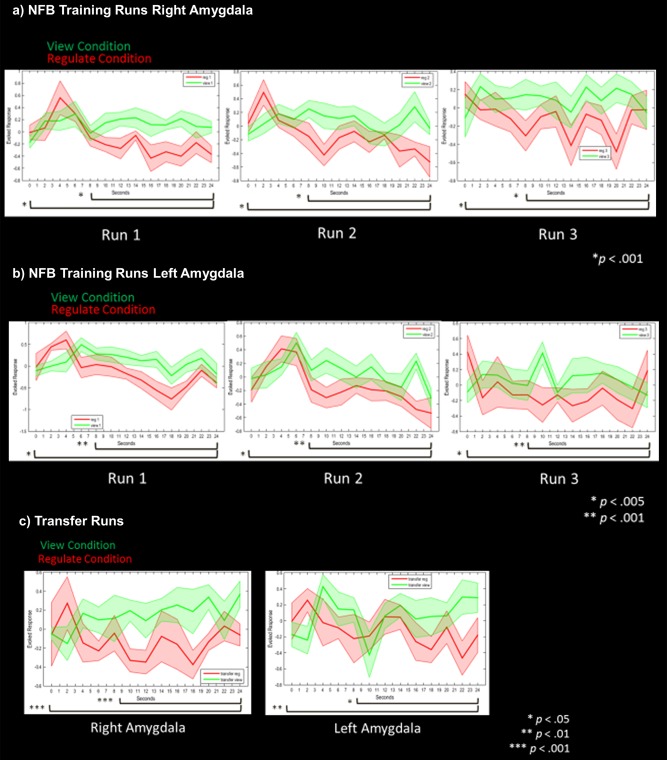
(a) Right amygdala parameter estimates corresponding to amygdala activation during neurofeedback runs for the view (solid green line) and regulate (solid red line) conditions. (b) Left amygdala parameter estimates corresponding to amygdala activation during neurofeedback runs for the view (solid green line) and regulate (solid red line) conditions. (c) Bilateral amygdala parameter estimates corresponding to activation during the transfer run without neurofeedback for the view (solid green line) and regulate (solid red line) conditions. Shaded red and green regions adjacent to the solid lines indicate standard error of the mean. Statistical thresholds corresponds to a‐priori paired sample t‐tests, comparing amygdala activation during view versus regulate across the whole condition, and for the last two thirds of the condition. Each of these respective t‐tests are indicated by the black bars on the bottom of each graph. Asterisks indicate Bonferroni corrected statistical thresholds for paired sample t‐tests. Abbreviations: NFB, neurofeedback. [Color figure can be viewed at http://wileyonlinelibrary.com.]