
Figure 3.
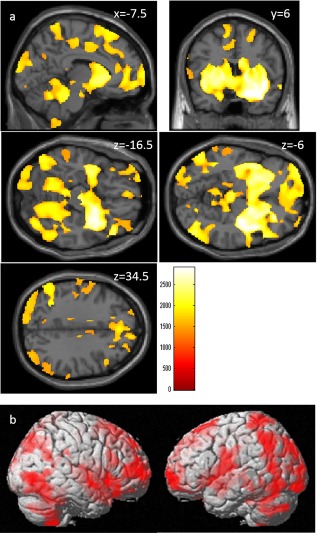
Positive correlations between VGEF genotype (number of C alleles) and rGMV. The results shown were obtained using a threshold of threshold‐free cluster enhancement (TFCE) of P < 0.05, based on 5,000 permutations. The results were corrected at the whole‐brain level. (a) Regions with significant correlations are overlaid on a “single subject” T1 image from SPM8. The color represents the strength of the TFCE value. Significant correlations were found in the extensive gray matter areas across the whole brain, particularly in subcortical areas. (b) Regions with significant correlations are projected onto the rendered brain from SPM8. Significant correlations were found in the extensive gray matter areas across the whole brain.