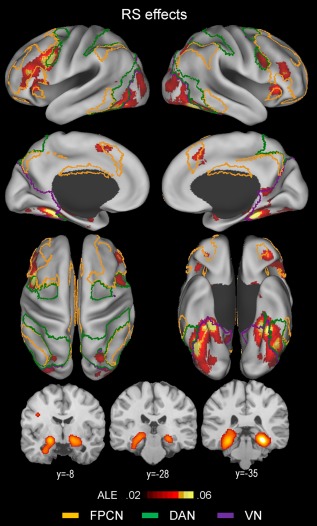
Figure 2.

Above‐threshold brain regions in an ALE meta‐analysis of all repetition suppression (RS; novel > repeated) experiments (n = 106). The yellow‐, green‐, and violet‐colored borderlines mark estimates of the frontoparietal control, dorsal attention, and visual attention networks, respectively. The boundaries were drawn from Yeo et al.'s [2011] 7‐network parcellation data (see Fig. 1). [Color figure can be viewed at http://wileyonlinelibrary.com]
