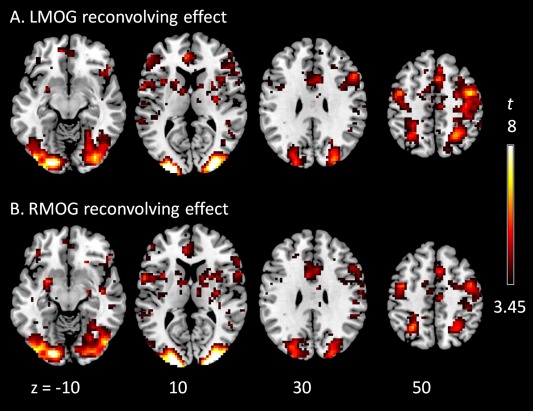
Figure 7.

Effects of deconvolution–reconvolution of the seed signals of the left (A) and right (B) middle occipital gyrus (LMOG and RMOG). The effects represent the reconvolution regressor in model 5 in Figure 3. Clusters were thresholded at P < 0.001 uncorrected. Z values represent z coordinates in MNI (Montreal neurological institute) space. [Color figure can be viewed at http://wileyonlinelibrary.com]
