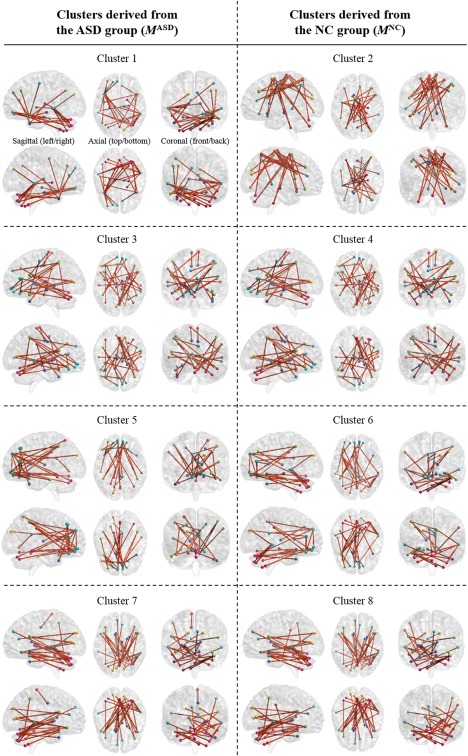
Figure 9.

Selected FCs by conducting t‐test on each cluster with their sagittal (left/right), axial (top/bottom), and coronal (front/back) views. Nodes denote ROIs and edges represent connections between ROIs. Only the 30 edges that have the largest statistical differences between ASD and NC (i.e., the smallest P value of t‐test) are presented to improve visibility. The FCs on each cluster become observations of the visible units of DRBMs, and the DRBMs find latent FCs by considering discriminative relations among the FCs. [Color figure can be viewed at http://wileyonlinelibrary.com]
