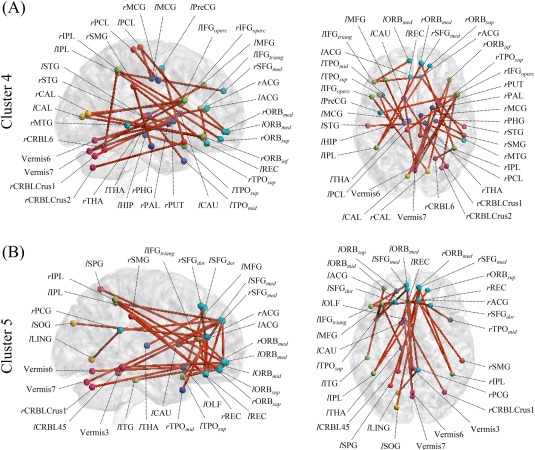
Figure 10.

Selected FCs in Clusters 4 and 5 with their right sagittal (left) and top axial (right) views. Nodes denote ROIs, the names of the ROIs are given in their abbreviated forms (refer to Table 2 for their full names), and edges represent connections between ROIs. Only the 30 edges that have the largest differences between group‐mean FCs of ASD and NC (i.e., the smallest P value of a t‐test) are presented to improve visibility. [Color figure can be viewed at http://wileyonlinelibrary.com]
