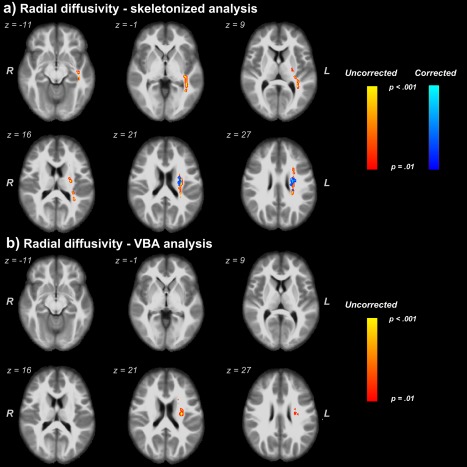
Figure 3.

Clusters with higher values of free‐water corrected and uncorrected RD in depressed subjects. (a) Comparison of RD and RD‐FW through the skeletonized analysis method. (b) WM regions found by VBA analysis for only the FW‐uncorrected RD. We report clusters at a significance threshold of P value < 0.01 corrected for FWE. Regions showing increased RD values are thickened using the TBSS fill script for emphasis. The results are overlaid onto the IITmean_t1 template. [Color figure can be viewed at http://wileyonlinelibrary.com]
