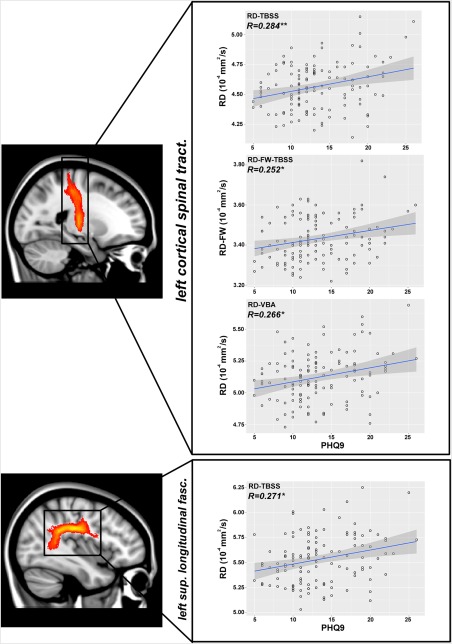
Figure 5.

Pearson's correlation coefficient (R) between RD index and PHQ‐9 in the left cortical spinal tract and in the left superior longitudinal fasciculus. **P < 0.01 (Bonferroni corrected); *P < 0.05 (Bonferroni corrected). [Color figure can be viewed at http://wileyonlinelibrary.com]
