
Figure 3.
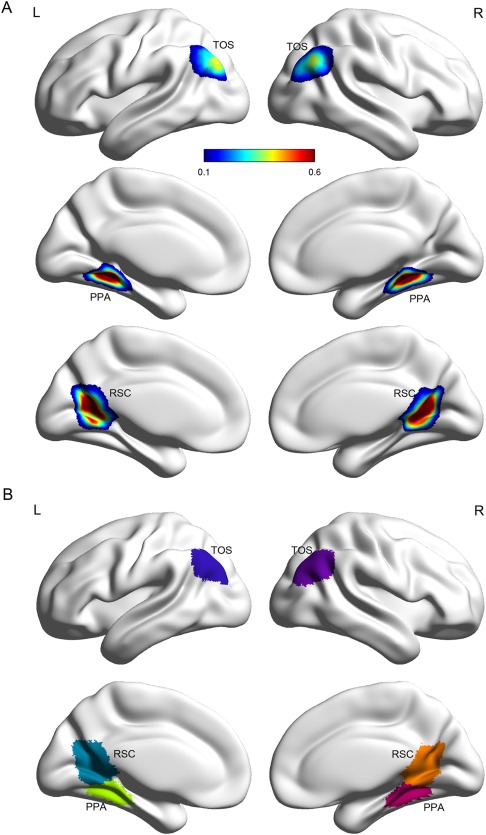
Probabilistic atlas and maximum probability map for the SSRs. (A) Probabilistic atlas displayed on the standard MNI152 cortical surface. The probability was calculated as the frequency of a respective SSR presented at a given position across all subjects. (B) Maximum probability map visualized as overlays on the MNI152 cortical surface. The value for voxels in which the maximal probability was smaller than 0.1 was set to zero, indicating that they most likely did not belong to any SSRs. Abbreviations: PPA, parahippocampal place area; RSC, retrosplenial cortex; SSR, scene‐selective region; TOS, transverse occipital sulcus; L, left hemisphere; R, right hemisphere.