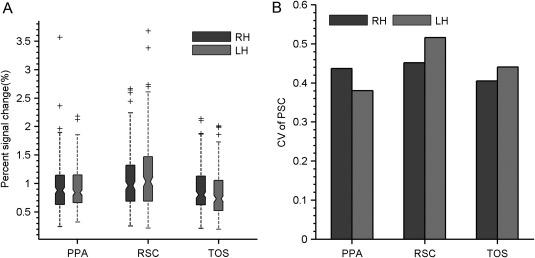
Figure 5.

The interindividual variability of scene selectivity. (A) The distribution of scene selectivity was summarized by a boxplot for each SSR. (B) Interindividual variation in scene selectivity quantified by the coefficient of variation. Abbreviations: PPA, parahippocampal place area; RSC, retrosplenial cortex; SSR, scene‐selective region; TOS, transverse occipital sulcus; LH, left hemisphere; RH, right hemisphere.
