Figure 1.

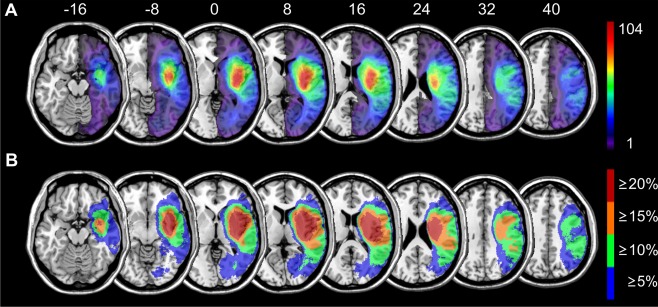
Topography of brain lesions. Lesion topography for all 274 patients with (A) continuous color scaling and (B) with an alternative step‐wise color scaling to show all voxels that were damaged in at least x% of all patients. Numbers above the slices indicate z‐coordinate in MNI space. [Color figure can be viewed at http://wileyonlinelibrary.com]
