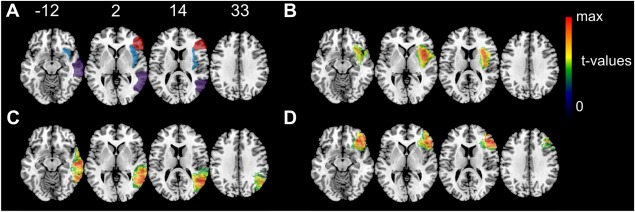
Figure 3.

Example t‐maps. For three regions of interest example t‐maps from Experiment 1 are shown. All maps originate from the condition with both control for lesion size and “control for sufficient lesion affection” in simulation and analysis. (A) Three regions of interest taken from the AAL atlas: insula (blue), middle temporal gyrus (purple), and inferior frontal gyrus, triangular (red) (B) VLBM results for the insula with t(max) = 7.35 (C) VLBM results for the middle temporal gyrus with t(max) = 7.91 (D) VLBM results for the inferior frontal gyrus, triangular with t(max) = 8.04. Color coding in B–D indicate t‐values thresholded to only show voxels with significant t‐values P < 0.05. Numbers above the slices indicate z‐coordinate in MNI space. [Color figure can be viewed at http://wileyonlinelibrary.com]
