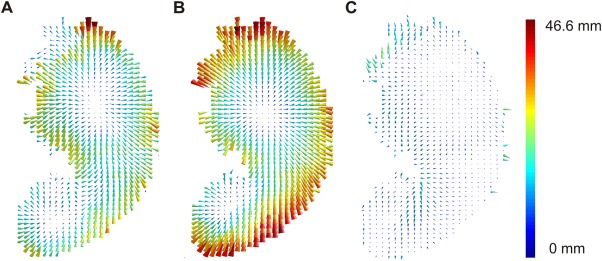
Figure 5.

Vector maps for “anatomical bias,” VLBM misplacement, and corrected VLBM misplacement. The vector graphics visualize the results of Experiment 2 exemplarily for slice z = 17. (A) Vector map for the misplacement of statistical VLBM results at P = 0.05. (B) Vector map for “anatomical bias.” Voxel‐wise vectors here were based on the inter‐voxel relation in the anatomical data, that is, on the data before any statistical analyses were applied. (C) Vector map for “corrected misplacement vectors” using the minimization factor k = 0.6495. For illustration purposes, the length of the vectors does not show the real vector length, but is scaled using the same factor in all graphics. Color‐coding indicates the length of the vectors in mm. [Color figure can be viewed at http://wileyonlinelibrary.com]
