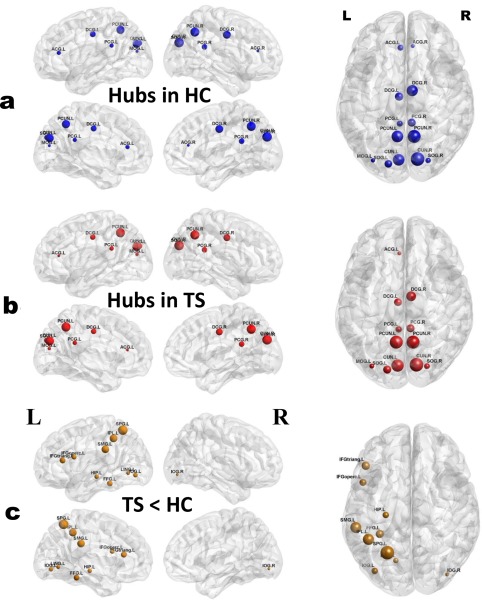
Figure 4.

Distribution of hub regions in the WM structural networks of the control and TS groups and nodes with decreased efficiency in TS children. (a,b) 3D representations of the hub distributions in the control (a) and TS (b) groups. The hub nodes are shown in blue and red with node sizes indicating their nodal efficiency values. (c) The disrupted nodes with the significant between‐group differences in the regional efficiency are shown in yellow, and the node sizes indicate the t values in t test. The brain graphs were visualized by using BrainNet Viewer software (http://www.nitrc.org/projects/bnv/). HC, healthy controls. For the abbreviations of nodes, see Table 2. [Color figure can be viewed at http://wileyonlinelibrary.com]
