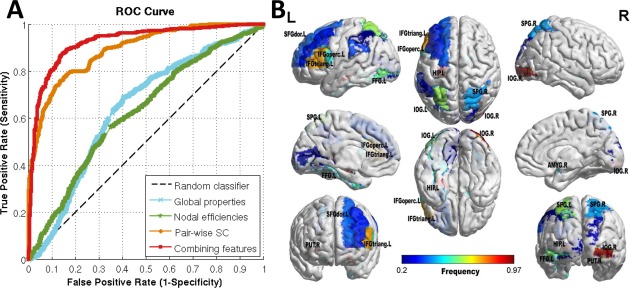
Figure 6.

Results of TS classification based on different types of features. (A) ROC curves of the classification results, which demonstrate the superior performance of using combined features over a single type of features. (B) Brain regions with nodal efficiencies identified as discriminative features for classification using MKL. The brain graphs were visualized by volume to surface function in BrainNet Viewer software. The regional colors with progressive shade (from blue to red) indicate the frequency of being selected by the nested CV procedure. Abbreviation is the same as Table 2. [Color figure can be viewed at http://wileyonlinelibrary.com]
