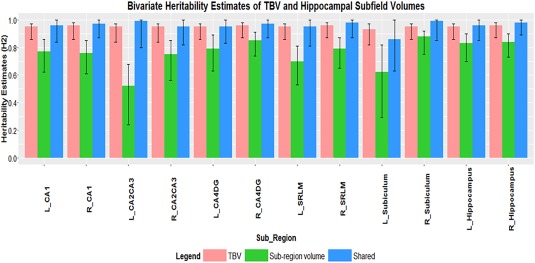
Figure 3.

Bivariate heritability scores (H 2) between TBV and left (L) and right (R) hippocampal subfields volumes, with 95% confidence intervals (sample size N = 465). Pink bars indicate heritability estimates of TBV, whereas green bars indicate heritability estimates of subregions (hippocampal subfields and whole hippocampal volumes) and blue bars indicates shared heritability estimates between TBV and subregions.
