
Figure 2.
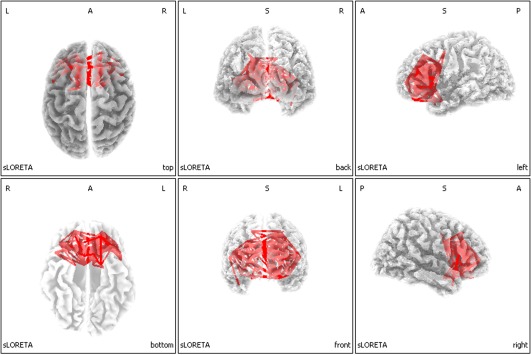
Results of the eLORETA comparison of EEG‐lagged linear connectivity between pre and postsleep onset condition in the sigma band at 12.5 Hz frequency. Red lines indicate connections, which presented increase of coherence after (POST) compared to before (PRE) sleep onset. [Color figure can be viewed at http://wileyonlinelibrary.com]