
Figure 4.
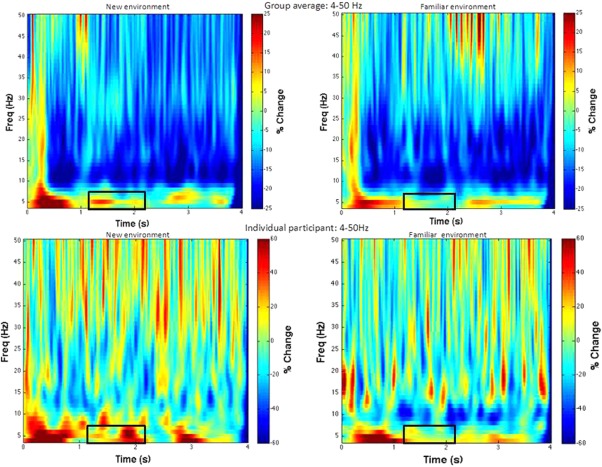
Time frequency plots (4–50 Hz) of the peak voxel of the environmental encoding related right hippocampus. The upper panel presents time frequency plots of the group average in the first (new environment) and the second (familiar environment) training set. The lower panel presents time frequency plots of one individual participant in the first (new environment) and the second (familiar environment) training set. The black rectangular shows the time window showing a decrease of theta band in the familiar environment relative to the new one revealed by SAM beamformer analysis (1.25–2.25s, 4–8 Hz). [Color figure can be viewed at http://wileyonlinelibrary.com]