
Figure 2.
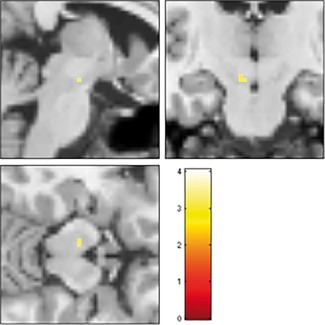
Relationship between city living and VTA activation by rewards (full sample, N = 147). Reduced bottom–up activation of left VTA by conditioned reward stimuli in low vs high urbanicity subjects [−4; −16; −14], t 290 = 3.26, P = 0.009 svc in DC; image shown at P < 0.001. [Color figure can be viewed at http://wileyonlinelibrary.com]