
Figure 4.
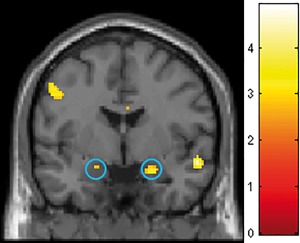
Effects of city living on amygdala activity in the desire context (DC) (full sample, N = 147). T‐map shows the result of the post‐hoc comparison between subjects with high versus low urbanicity score when they accepted the additional reward in desire context. Significantly higher amygdala activation (blue circles, left [−20; −2; −16] t 290 = 2.76, P = 0.032 svc; right [22; −2; −18], t 290 = 3.64, P = 0.002 svc) was observed for subjects with high urbanicity scores. Crosshair at 0 −2 −18; for display purposes, the image is shown at P < 0.005 uncorrected. [Color figure can be viewed at http://wileyonlinelibrary.com]